
Technical analysis is the art of interpreting price trends through charts and indicators, aiming to predict future market movements. While it’s an accessible and engaging method for many new traders, its predictive power is limited—price fluctuations depend on various factors, from supply and demand to unexpected events. In contrast to fundamental analysis, which focuses on the intrinsic value of an asset, technical analysis is more about spotting trends. But remember: no chart or tool can guarantee the future, so trade with caution.
In this article:
- What is Technical Analysis?
- The starting point for many new traders
- Some books and resources
- The mainstream fortune of technical analysis
- Mastering charts: a key skill for traders
- The limits of Technical Analysis
- The key lesson from Technical Analysis: price changes!
- Interpreting shapes in charts
- Indicators in Technical Analysis
- Candlesticks in Technical Analysis
- Technical Analysis vs. Fundamental Analysis
- Which one is better?
What is Technical Analysis?
The “art” of interpreting market data takes many forms. Perhaps the one that has evolved the most over time is what we call Technical Analysis.
If we try to give a definition of technical analysis, we’ll see that it’s not just a single technique but a collection of tools and methods that traders and investors use for one main purpose: to attempt to predict the future price movement of a financial asset, such as a stock (though it can be applied to any financial asset).
So, technical analysis has the ambition to give predictions: based on past data, technical analysis seeks to forecast price direction: whether it will go up, down, or somewhere in between.
But is it truly possible to predict the future price of an asset? Let’s dive into it.
The starting point for many new traders
It’s quite common for many new traders – as they step into the world of stock trading – to begin their journey with technical analysis.
Like many others, I started my trading journey by learning a bit about technical analysis.
It felt almost instinctive to me — there were these charts, with price lines constantly moving up and down (and sometimes wandering a bit horizontally for some time…) and I just wanted to make sense of them.
Technical analysis seemed like the right choice — the perfect instrument, rational and logic-driven, that offered the promise of predicting how a stock’s price trend would behave.
All I had to do was put in the work of learning some of its tools, which were not too bad at all — I mean, they were not too difficult. Sure, there’s some math behind it, but you don’t even need to do the calculations yourself. It just makes extensive use of charts and other tools to represent price trends.
Some books and resources
When I began learning about trading, a quick online search pointed me to various resources, including books and websites.
One standout introduction to technical analysis is The Complete Trading Course by Corey Rosenbloom, which many reviews describe as “the only technical analysis book you need.”

There are numerous other excellent books on the subject, such as Technical Analysis of the Financial Markets, by John Murphy, which is considered very comprehensive.
As for online resources, it was important for me to keep costs low, and fortunately, many of the best materials are available for free.
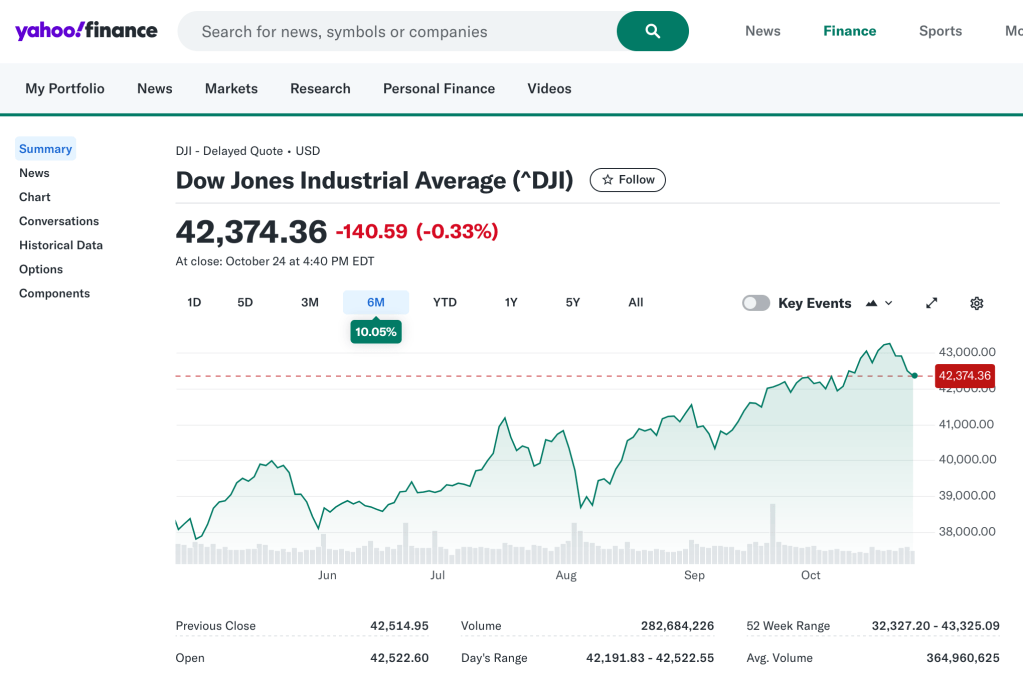
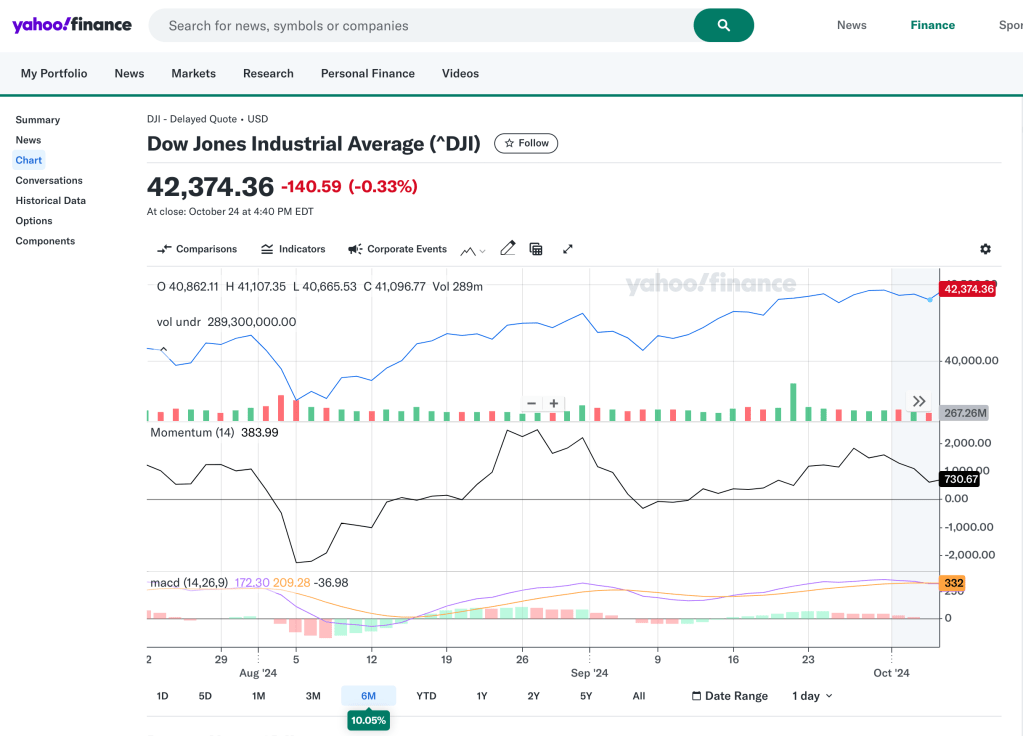
A great reference for traders and finance enthusiasts is Yahoo Finance. This platform not only provides news but also offers a market data section where you can access charts, historical data, information about upcoming events like IPOs (initial public offerings), and much more.
Another valuable educational website is Investopedia. It offers a wealth of articles on financial topics and features a free simulator that allows users to practice trading with real market data in almost real time. This is an excellent way to learn about trading without risking actual money.
The mainstream fortune of technical analysis
So, why technical analysis has so much success among new traders? Here’s my list of 2 or 3 reasons that I think are solid motives behind that success.
1) It’s Easy to Learn
After all, it’s not that difficult to learn. As I mentioned from my own experience, you just need to study some of the tools, get a solid understanding of how to read charts and time frames, and you’re good to go. It can even become quite addictive, or “fun,” as you find yourself in a game with the market, trying to identify price trends.
2) Free Access to Market Data
Thanks to the vast amount of data available today — much of it free on the web — it’s easy to access market information and resources. For instance, websites and companies like Yahoo provide excellent tools for traders. Take the mentioned Yahoo Finance, for example: its market data section is packed with charts and indicators, making it an exceptional resource for learners.
3) The Illusion of Control
This is the most powerful reason for its success: technical analysis gives new traders the illusion that they can predict price trends and, therefore, the illusion of control over their investments. This can be quite dangerous, but it’s also at the heart of what makes technical analysis so intriguing.
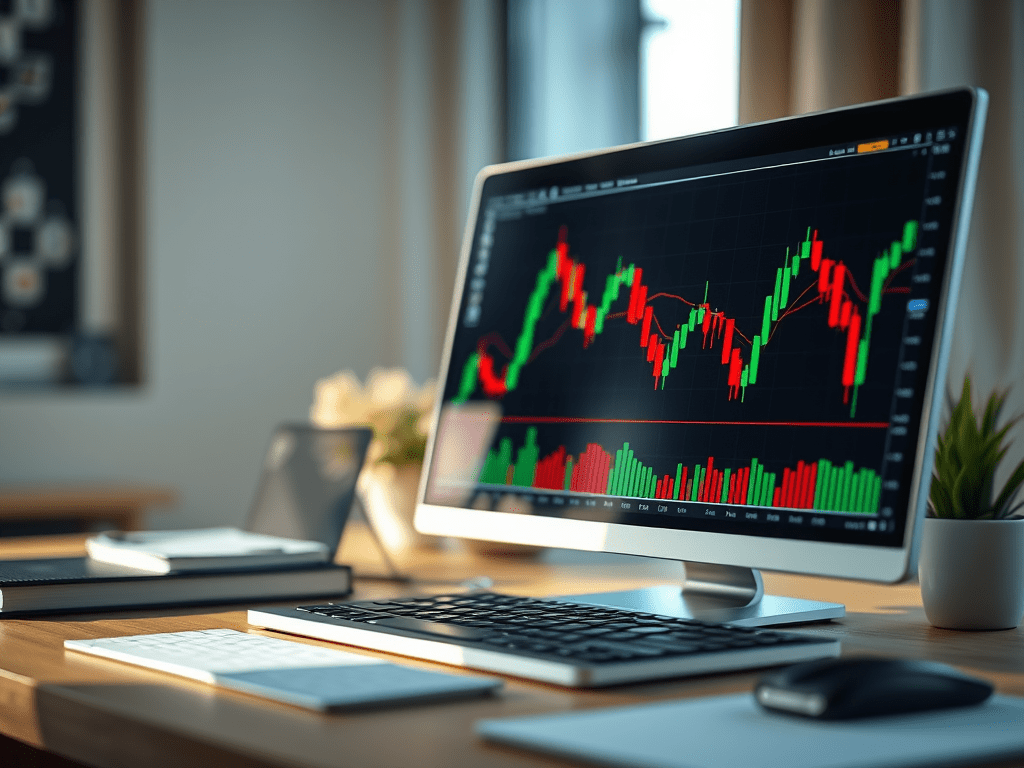
Mastering charts: a key skill for traders
If one wants to be a trader, a bit of proficiency in reading charts is necessary. This holds true for any trader, regardless of their preferred methods or type of trading.
Technical Analysis, in particular, makes extensive use of charts. So, a big part of becoming proficient in technical analysis is learning how to read and interpret charts.
The fluctuation of price on a chart isn’t just a meaningless line — it represents a trend, specifically the price trend.
Here are some typical definitions used in technical analysis for the study of price movements on a chart:
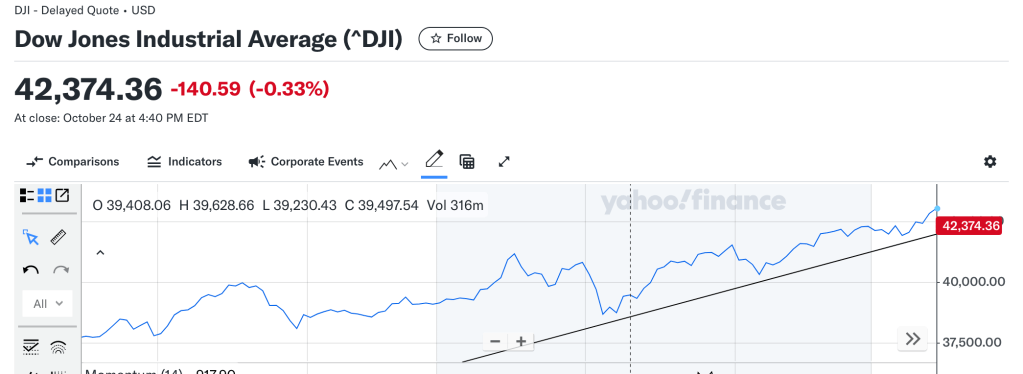
Trendline: a trendline is a straight line drawn on a chart to connect a series of price points, showing the general direction (trend) of the price—whether it’s moving up, down, or sideways. It can be an imaginary line, or you can even do it yourself, drawing with a pencil on a printed chart, or on screen, with the aid of software or online financial websites that offer that possibility.
Swing: Swing is a generic and broad term that can be defined as “price movement”. So, swings refer to the highs and lows in price movement that create a wave-like pattern. The price “swings” up to a peak or down to a curve, forming trends.
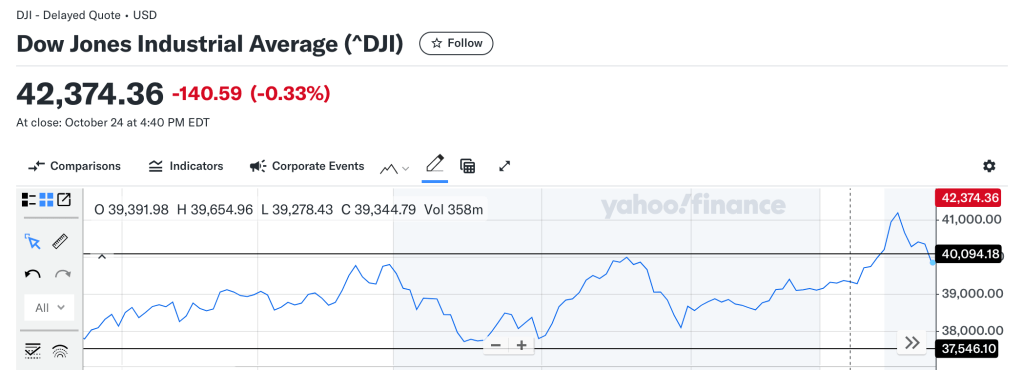
Support and Resistance: Those are other “imaginary lines”. Support is a price level where a stock tends to stop falling, while resistance is where it tends to stop rising. Think of them as invisible barriers on a chart.
The limits of Technical Analysis
We said that technical analysis aims to assess, based on past price movements (whether in the recent or distant past), where the price is likely to go.
Unfortunately, that is a mere illusion. The predictive power of technical analysis fades in the face of market uncertainty and, ultimately, reality.
Technical analysis can’t predict sudden events, news, or other random variables that inevitably affect price movements. A sudden shift in price, caused by something like a geopolitical crisis or a bankruptcy, can’t be foreseen or reflected in previous price fluctuations.
So, young or inexperienced traders should be warned: there’s no guarantee of where a price will go.
So, what use is technical analysis? Simply to identify trends — the trends of today, the past days, and the past years. No more, no less.
Without any certainty of the future, it’s crucial to remember that in stock trading, no chart, indicator, or tool can offer you assurance of a future trend.
Let’s be clear and immediately debunk any myths about technical analysis: past trends don’t necessarily predict future ones.
The key lesson from Technical Analysis: price changes!
Perhaps the most important concept to take away from everything in technical analysis is that price fluctuates. It changes in response to supply and demand.
For example, if investors believe the price of an asset (like a stock) doesn’t reflect its true value, they sell. This causes the price to drop. On the other hand, when investors think the value of a company or asset is higher than its current price, you’ll see the price go up as they start buying.
Understanding that the law of supply and demand drives price trends is a great starting point.
However, a trader should also be aware that emotions play a huge role in the stock market. A stock’s price doesn’t always mirror its true value (assuming that value can even be assessed).
Fear, panic, the hope for big gains, and other powerful emotions often drive price movements.
Interpreting shapes in charts
When diving into technical analysis, you can go as deep as you want. In the quest for identifying patterns and recurring “price behaviour,” traders have identified shapes formed by price lines on charts.
These shapes are believed to suggest future price trends. But again, there’s no assurance or guarantee that a future price will behave as these shapes might suggest.
Just because something happened in the past doesn’t mean it will repeat in the future. This is a crucial point to remember while trading.
Some of the most well-known shapes include the “head and shoulders,” the “dead cat bounce,” and more. Let’s take a look at a few of the most common patterns:
Head and shoulders: This pattern resembles a head with two shoulders on either side. It’s considered a sign of a potential reversal in trend—when a stock is about to move from bullish to bearish, or vice versa.
Dead cat bounce: This is a temporary recovery in a downtrend, followed by a continuation of the decline. It’s often misleading, as the brief rise in price can give false hope to traders.
Cup and handle: This pattern looks like a teacup and suggests a potential bullish continuation. After a rounded dip (the “cup”), a brief consolidation (the “handle”) occurs before an upward breakout.
Indicators in Technical Analysis
You can’t claim to do technical analysis without knowing at least some indicators. But what are they?
In simple terms, indicators are mathematical tools that you can now easily superimpose on a chart, and they supposedly help in identifying the trend of a price. The math behind them is often quite simple, though some indicators can be more complex.
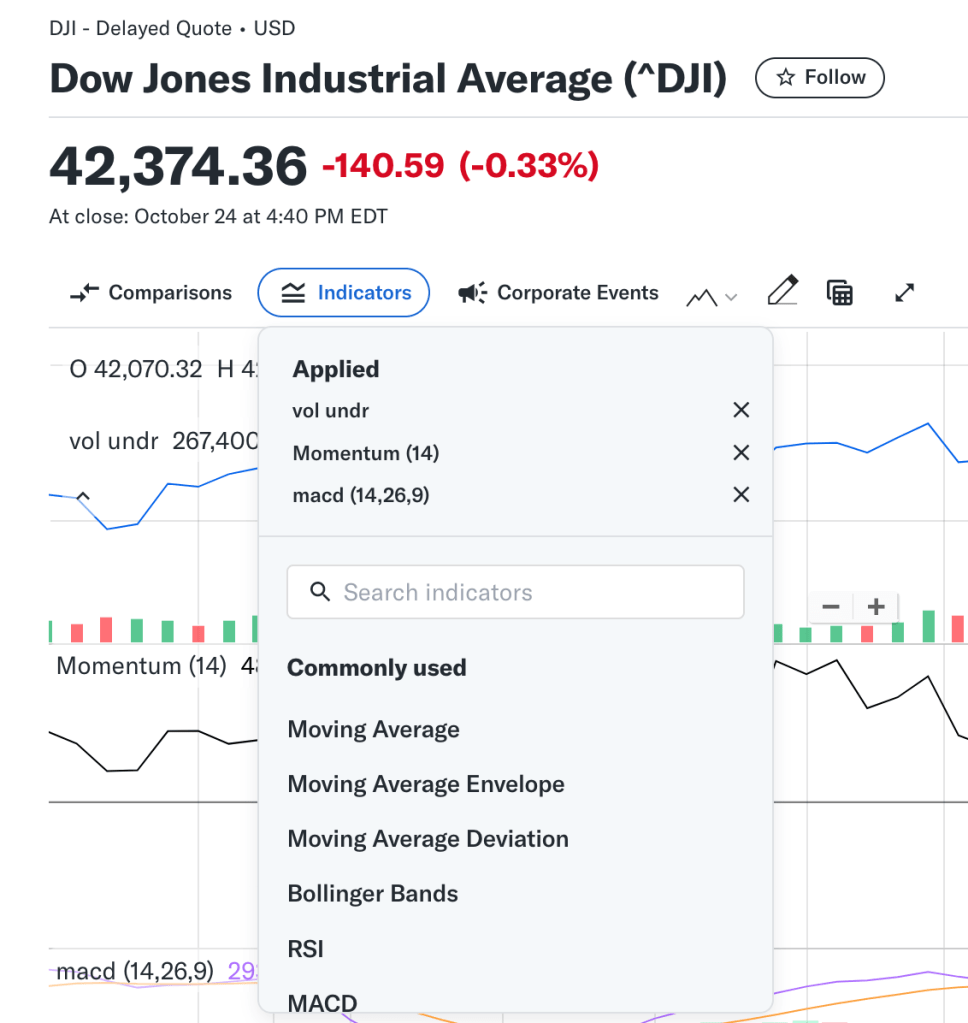
For any trader, I believe it’s more than enough to get familiar with just a handful of indicators. These are arguably the essential ones:
Volume: This measures the total number of trades for a given asset within a specific period (usually each day). It shows how much activity is going on with a particular stock—high volume may indicate strong interest, while low volume can suggest a lack of conviction in price movements.
Moving Averages (MA): A simple calculation of the average price over a set time period, often used to smooth out price fluctuations. For example, a 50-day moving average shows the average price over the past 50 days, helping traders identify the overall trend.
Momentum: This measures the speed at which the price is moving. It’s useful for seeing whether a price is gaining or losing strength. When momentum is high, it often signals strong buying or selling pressure.
MACD (Moving Average Convergence Divergence): This momentum indicator compares two moving averages and signals when they converge or diverge. It helps in identifying “possible” buy or sell opportunities based on the crossover of these averages.
Do these indicators decisively predict the price trend? Again, they’re helpful for identifying trends, but, like everything in technical analysis, they don’t guarantee that the price will move in a certain direction with certainty.
Candlesticks in Technical Analysis
A significant number of traders, especially those involved in short-term trading like day trading, prefer to display price data using candlesticks.
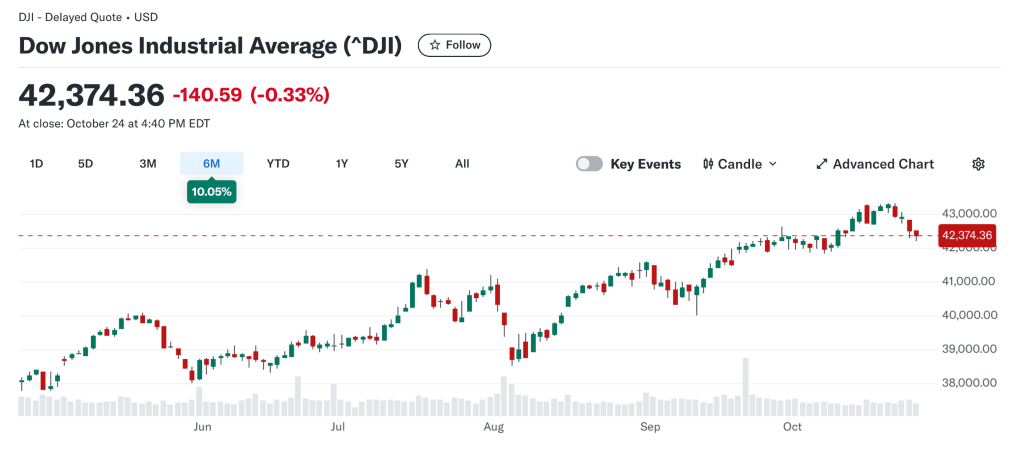
For completeness, I’ll give a brief description of candlesticks, since they are a part of technical analysis and are widely used in charts you’ll find online. However, I must say that I don’t personally use them and I’m not particularly fond of this method.
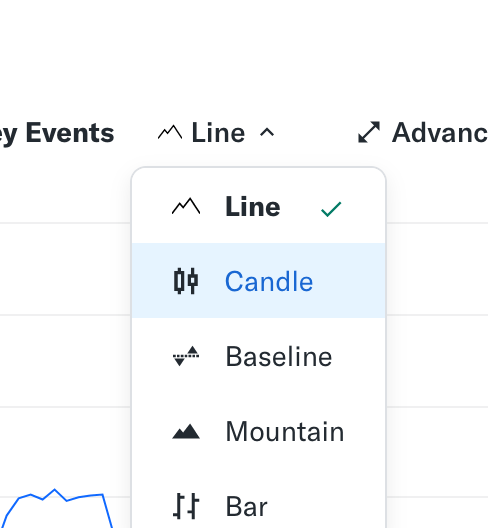
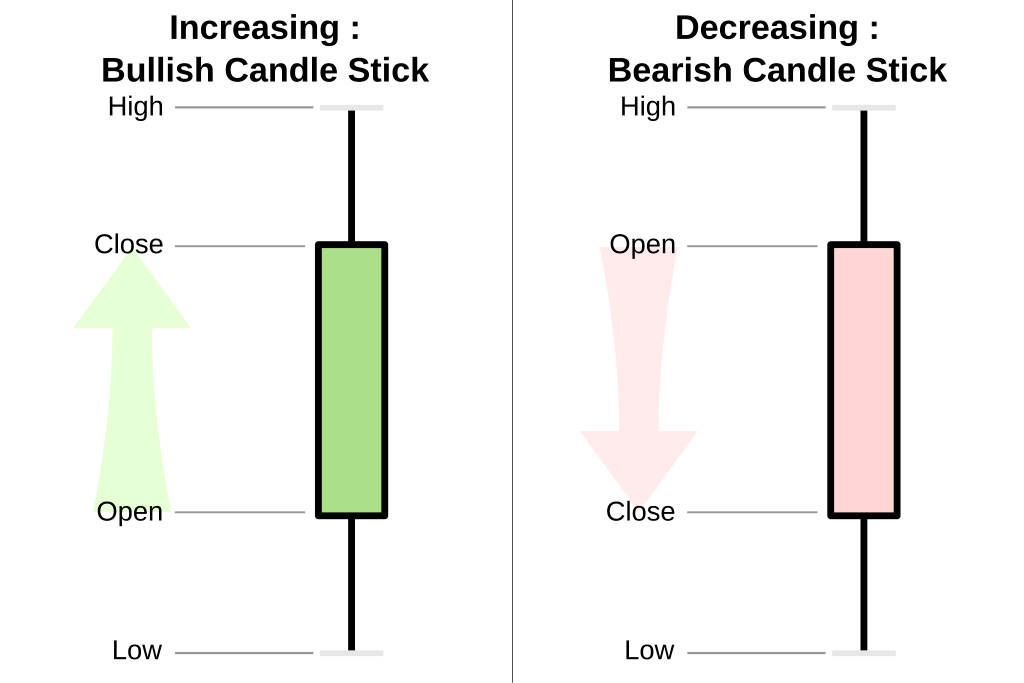
So, what exactly are candlesticks? They’re a graphical representation of price movements, and they show four key data points for a specific time period: the opening price, the closing price, the highest price, and the lowest price.
Each candlestick consists of a “body” (the range between the open and close) and “wicks” (the high and low points). This visual format is meant to be sensitive to price fluctuations and is favored for its ability to provide a lot of information at a glance.
Many traders who engage in day trading rely heavily on candlesticks because they believe these charts are highly responsive to price changes. Additionally, traders have identified numerous patterns within candlestick charts, many of which are believed to signal potential price movements. There are plenty of resources online if you wish to dive deeper into candlestick patterns.
As for me, I don’t use candlesticks for several reasons:
I don’t do day trading. This blog, MoneyPlato, is not focused on day trading — a practice that, in my opinion, should only be pursued by a very select group of people. Day trading can be both risky and stressful.
My philosophy on investing and trading, which you might have picked up on by reading this blog, revolves around long-term investing with the aim of reducing stress as much as possible.
For me, that means looking at your assets as infrequently as possible and leaving them alone.
Candlestick analysis can be time-consuming. I believe that delving too deeply into candlestick patterns and similar technical details can be a major distraction, narrowing a trader’s perspective too much.
The world of investing — and the world itself — is much broader and richer than what can be captured by short-term chart patterns.
Technical Analysis vs. Fundamental Analysis
The focus of this post has been on technical analysis, but it’s important to remember that it represents just one of two major schools of thought in stock trading. The other is fundamental analysis.
We have seen that technical analysis is all about charts, graphs, and price trends. It focuses on price movements and patterns to make predictions about future trends.
Fundamental analysis takes a different approach. It looks at the underlying value of a company by examining its financial health, earnings, growth potential, and industry position to determine whether a stock is overvalued or undervalued.
Fundamental analysis is more like the work of an accountant or auditor: it deals with a company’s balance sheet, reviewing its expenses, profits, debt levels, and the past trends of these elements. It also involves forecasting profits and debts for the future.
Fundamental and Technical analysis are different, but they represent the fact that there are countless ways to try to interpret the stock market, each with its own reasoning and logic.
Some people buy stocks based purely on intuition, because they “know” or “feel” that an investment is a good opportunity. This is possible only if an investor has a lot of experience. These buyers often don’t even look at the stock price—they just buy.
While that kind of “financial wisdom” may seem admirable, in reality, most of the time, some level of study or at least evaluation is necessary for the average investor (with far less cash available) to create a long-term strategy and avoid buying every random stock that catches their eye.
Which one is better?
It’s difficult to say which approach is better in trading — technical, fundamental analysis, or different. The truth is, there’s no definitive answer, and choosing one over the other can be tricky.
What’s important to understand is that mistakes and errors of judgment are always possible, even for the most brilliant minds. Being overly reliant on a single method, or believing that you’ve perfectly identified the course of an asset, can lead to significant losses.
There’s a famous anecdote that serves as a cautionary tale in this regard. In the early 18th century, Sir Isaac Newton—one of the greatest minds in history, a philosopher, mathematician, physicist, and inventor—made a disastrous error in trading. Despite being the father of the laws of universal gravitation and a financial expert in his time, Newton fell victim to the South Sea Bubble, a major financial crisis.
The South Sea Company had captivated investors with its promises of enormous profits, leading to a speculative frenzy. Newton initially saw the bubble for what it was and pulled out of his investments, pocketing a tidy profit. But as the stock price kept climbing, groupthink got the better of him, and he plunged back in, ultimately losing a significant portion of his fortune when the bubble burst.
.jpg)
The moral of the story? Even a mind as brilliant as Newton’s couldn’t escape the unpredictability of markets. Whether you lean toward technical or fundamental analysis, it’s crucial to remain humble, cautious, and aware that no method can perfectly predict the future.
The markets have a way of humbling even the most confident traders, so maintaining a balanced and flexible approach is often the wisest course of action.
Let me know if you ever tried to apply technical analysis in your trading experience, or if you have some questions!
Write in the comments below or feel free to contact me.
Cheers,
Lorenzo


Leave a comment